Test Strategy

In This topic we will discuss, what is a Test Strategy, Why test strategy is required, how to create a Test Strategy, Defining Test Strategy, Requirements in Test Strategy and Key points to remember in Test Strategy.
A Quick and simple introduction to Test Strategy:
1. Test strategy is statement of overall approach of testing to meet the business and test objectives.
2. It is a plan level document and has to be prepared in the requirement stage of the project.
3. It identifies the methods, techniques and tools to be used for testing .
4. It can be a project or an organization specific.
5. Developing a test strategy which effectively meets the needs of the organization/project is critical to the success of the software development
6. An effective strategy has to meet the project and business objectives
7. Defining the strategy upfront before the actual testing helps in planning the test activities

Why do a Test Strategy? The Test Strategy is the plan for how you are going to approach testing. It is like a project charter that tells the world how you are going to approach the project. You may have it all in your head, and if you are the only person doing the work it might be OK. If however you do not have it all in your head, or if others will be involved, you need to map out the ground rules.
Download the sample Test Strategy Document
As per James Bach “A good test strategy is:
– Specific
-Practical
– Justified
Test Approach and Test Architecture are other terms commonly used to describe what I’m calling test strategy.
Example of a poorly stated (and probably poorly conceived) test strategy:

“We will use black box testing, cause-effect graphing, boundary testing, and white box testing to test this product against its specification.”


A test strategy will typically cover the following aspects:
1. Definition of test objective
2. Strategy to meet the specified objective
3. Overall testing approach
4. Test Environment
5. Test Automation requirements
6. Metric Plan
7. Risk Identification, Mitigation and Contingency plan
8. Details of Tools usage
9. Specific Document templates used in testing

Contents:

A simple approach to Software Test Estimation

A very simplistic method for estimating testing time can be as follows for a typical black box testing assignment .
Total Time=No of cycles*(Time for each testing cycle+time for fixing of bugs found in one cycle)
So if you have an estimated time of testing cycle as 6 days and you expect that the developers are going to take 4 days for fixing bugs found in one cycle and if the number of testing cycles are estimated as 4 then
Total time = 4*( 6+4)
Total time= 40 days

But this is very simplistic model but is useful for simpler projects.

A little more complex model for estimating software testing time involves:
1 Categorizing Software Requirements resulting into number of requirements-they can cover business,technical,functional and performance
2 Using a Complexity Constant ( e.g 1 for simple and 1.5 for complex)
3 Applying Risk Factors (e.g ranging from 1.1 to 1.5)
4 Applying a General Contingency Factor (e.g 1.15-1.35)

So one cycle time =No of requirement*complexity constant*risk factor*contingency factor.

If you are implementing the above methods, the you need to consider some other factors also:
When you run test estimation, you can estimate efforts for tasks belong to the Test Team. You cannot figure out a correct estimation for tasks which much depend on developers such as builds release for testing and bug fixing. Normally Builds are released very late to testers and testers have to change their schedule. In addition, Testers do not know and control how bugs are fixed. That is why the hardest part of test estimation is from test execution phase.

The best way to calculate test efforts is you should know how to size projects with function point approach. However, it is not easy task either.

Software Testing Effort Estimation

Software Testing Effort Estimation

This topic is a mixture of practical experiences and estimation theory (estimation science, theoretical knowledge). The purpose of this topic that the Test Leads, Managers or aspiring leads, managers must aware of all the test estimation techniques. This will helps in clearing interviews and in test planning as well. In the upcoming topics we will discuss the Guidelines and Principles for Test Estimations.
 
Introduction – Estimation is done often because it is expected to help in predicting how much will the project cost and when will the project get completed. Proper analysis and effort estimation is necessary for successfully planning for a testing project. Any flaw in critical estimation phase, results in missing the project deadlines, reduces ROI and loses of customer’s faith. Remember – Bad estimation can lead to poor distribution of work. 

There are different standard and non standard methods for test estimation. In many product based companies, people utilize non standardized but conventional estimation methods to make things work. These methods might have developed over a continuous period accommodating hidden factors like nature of application under test, environment, and risk factors for that specific product/market. But these methods can’t be adopted as a generalized organization standard for a mature operation model.

Fact: Managers/Leads are not comfortable with software estimation work. But it is a required activity, so based on their past experience on one particular Product, Test Leads/Test Managers estimate the entire testing project (but for that Product only). Because they spent 1-2 or 2-3 or even more years on that particular product. But if they are asked to change company or shift to new product of entire different domain, then it is very hard for them to do estimation.
In this topic, we will discuss following methods for test estimation:
1. FIA (finger in the air) or best guess
2. Ad-hoc method
3. Experience Based – Analogies and experts
4. WBS
5. Delphi technique
6. Three-point estimation (successive calculation)
7. Function points / Test point Analysis
8. Percentage of development effort method
9. Percentage distribution
10. Use case point estimation method
 
Lets discuss one by one:
1. Best Guess – This technique is purely guesswork and based on the some sort of experience.
The method is very common, but since it is based on your gut feeling, its uncertainty contingency is probably around 200% or even higher.

2. Ad-hoc method – The test efforts are based on tentative timeframe. The timeline set by managerial or marketing personnel or by client without any guess/experience. Alternatively, it is done until the budgeted finances run out.
This is very common practise in extremely immature organizations and has error margins of over 100% at times.

3. Experience Based – Analogies and experts:

  • Metrics collected from previous tests.
  • You already tested similar application in previous project.
  • Inputs are taken from Subject Matter experts who know the application (as well as testing) very well.

4. Work Breakdown Structure – It is created by breaking down the test project into small pieces. Modules are divided into sub-modules. Sub modules are further divided into functionalities and functionalities are divided in sub-functionalities.
Review all the requirements from Requirement Document to make sure they are added in WBS. Now you figure out the number of tasks your team needs to complete. Estimate the duration of each task.

5. Delphi technique – Same as above WBS. Here functionalities and each task is allocated to each team member. Then team member gives estimate that they will take this much hours to complete the task.
Averagely, this technique gives good confidence in the estimation. This technique can be combined with other techniques.

6. Three-point estimation – This technique is based on statistical methods In this technique, task is broken down into subtasks (similar to WBS) and then three types on estimation are done on each chunk –

  • Optimistic Estimate (Best case scenario in which nothing goes wrong and all conditions are optimal.) = a
  • Most Likely Estimate (most likely duration and there may be some problem but most of the things will go right.) = m
  • Pessimistic Estimate (worst case scenario which everything goes wrong.) = b

Formula to find Value for Estimate (E) = a + (4*m) + b / 6
Standard Deviation (SD) = = (b – a)/6
More information about this technique can be find at:
http://www.projects.ed.ac.uk/methodologies/Full_Software_Project_Template/EstimationGuidelines.shtml

7. Function Point/Testing Point Analysis: The FP technique is a direct indicator of the functionality of software application from the user’s perspective. This is the most accepted technique used to estimate the size of a software project.
This technique is a part of TMap. Base of this technique is function point technique. Here we convert function points into test points. In Test Point analysis, we usually carry out the following:

  • Dynamic Test Points
  • Static Test Points
  • Environmental Factor
  • Productivity Factor
  • Primary Test Hours
  • Control Factor
  • Total Test Hours

You can download the detailed self explained presentation here –
http://www.eurostarconferences.com/community/member/eurostar-presentations-archive/test-effort-estimation-with-test-point-analysis.aspx

In Testing, This estimation is based on requirement specification document, or a previously created prototype of the application. To calculate FP for a project, some major components are required.
The major components are:
Unadjusted Data Function Points: i. Internal Files, ii. External Interfaces
Unadjusted Transaction Function Points: User Inputs, ii. User Outputs & iii. User Inquiries
Capers Jones basic formula:
Number of Test cases = [Number of Function Points] x 1.2
Total Actual Effort, TAE = (Number of Test cases) * (Percentage of development effort /100)
This method is done in a case when a detailed low level design document or requirement document is available (i.e measure of function point is available) & Previous data for development and testing is available. But now days, when we are using agile and iterative methodologies to deliver projects, so most of the times all this documentation is not available.

8. Percentage of development effort method
Here the assumption is that a more complex business application may require more testing effort. The test effort required is a direct proportionate or percentage of the development effort.


Note: The development effort can be estimated using line of code (LOC) or function point (FP) which is not in the our scope.
Example:
If a previous project with 500 FPs required 50 man hours for testing, the percentage of testing effort is calculated as:
P = (50 / 500) * 100 =10%
For the current project with a development effort, say 1500 FPs, the testing effort is:
Total Actual Effort, TAE = 1500 * (P/100) = 1500 * (10/100) = 150 man hours.

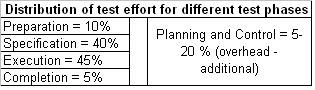
9. Percentage distribution – Here all the phases of SDLC are divided in parts and assigned effort in %. Like –
Project management 7%
Requirements 9%
Design 16%
Coding 26%
Test (all test phases) 27%
Documentation 9%
Installation and training 6%
Now testing % is further distributed into all testing phases:

OR

All phases %
Component testing 16
Independent testing 84
Total 100
Independent testing %
Integration testing 24
System testing 52
Acceptance testing 24
Total 100
System testing %
Functional system testing 65
Non-functional system testing 35
Total 100
Test Planning and Design Architecture 50%
Review phase 50%

10. Use case point estimation method: Use case point (UCP) method is gaining popularity because now-a-days application development is modelled around use case specification. The test case development is normally kicked off after baseline use case. So the various factors in use case give a direct proportion to the testing effort. 
Use case is a document which well specifies different users, systems or other stakeholders interacting with the concerned application. They are named as ‘Actors’. The interactions accomplish some defined goals protecting the interest of all stakeholders through different behaviour or flow termed as scenarios.

UCP Estimation Method in brief
1. Obtain unadjusted actor weight (UAW)
2. Determine unadjusted use case weight (UUCW)  
3. Calculate unadjusted use case points (UUCP) UUCP = UAW + UUCW
4. Determine the technical/environmental factor (TEF)
5. Compute the adjusted use case point (AUCP) AUCP = UUCP * [ 0.65 + (0.01 * TEF)]  
6. Arrive at final effort using a conversion factor Total Actual Effort = AUCP * CF

Conclusion
There can’t be a sole hard and fast rule for estimating the testing effort for a project. There may be different other methods also which can be effectively used for the purpose. It is recommended to add on to the possible knowledge base of test estimation methods and estimation templates constantly revised based upon new findings.

Estimation Guidelines for Testing Projects

There are several factors, which have to be considered while estimating a testing project. The stability of the application to be maintained is a crucial element while estimating testing projects. A generic estimation methodology is very difficult to arrive at. At best, one could highlight the factors that influence estimation in such projects. Hence estimation largely is based on the information and experiences from previous projects. As in other cases these estimates are validated as the project progresses.
Estimation Factors:

S.No Type Factor Impact Remarks
1 Framework Availability High Good framework makes your scripting, debugging and maintenance easier. Do understand that framework needs continuous updating across the script development.
2 Application Repeat functionality High It is quite easier to automate incase the functionality repeats across the application (Recommend to use keyword driven in such cases, as you do not end up in writing more action/verification based methods). If NOT, then the effort of building libraries and/or scripts is more linear in nature.
3 Project Test Scope High If the complexity of application as well as the test scope is complex in nature, then it would consume huge efforts to automate each test case.
4 Test tool Support to AUT Medium The test tool to be used may not support some application functionality and may cause overhead. You may find it more difficult to get started with open source scripting and/or tools.
5 Scripter Skill Medium This costs project. The right skill packages of the scripter are very essential for any good test automation. If the customer NOT willing to provide the leverage on the estimate for this factor, do NOT forget to add the learning curve cost to the overall time.
6 Application Custom Objects Medium The number of custom objects in the automation scope matters as it becomes overhead for the test automation team to built and maintain the libraries for them.
7 Application Type (Web/ Client-Server / Mainframe) Medium For web application, any commercial test tool has amazing utilities and support. Otherwise, there are good possibilities that you need to spend huge effort in building libraries.
8 Application Developed Language & Medium Low It matters as selected test tool does not support specific verification checkpoints.

Assumptions Made while Estimating
While estimating a project, all the assumptions made should be written down in detail.


The Rules

Estimation shall be always based on the software requirements
Estimation shall be based on expert judgment
Estimation shall be based on previous projects
Estimation shall be based on metrics
Estimation shall never forget the past
Estimation shall be recorded
Estimation shall be supported by tools
Estimation shall always be verified


Procedure for estimating:
1. The requirements are gathered and based on the requirements the following are to be identified:

  • Number of new test script/test case (in case of creation)
  • Number of changes in the test script/test case (in case of updating)
  • Complexity of the test script/test case – Major, Medium and Minor.

2. The general hours are then estimated based on the below assumption:

Creation (below is just an example, HOURS you need to be change for your project):

SEVERITY HOURS
Major
GUI 8-12
Functional 12-16
Medium
GUI 6
Functional 6-8
Minor
GUI 4
Functional 4


Updation:

SEVERITY HOURS
Major
GUI 6
Functional 8
Medium
GUI 4
Functional 6
Minor
GUI 1-2
Functional 1-2

3. The estimation is also based on the time of execution, specific to automation:

  • 1st time execution = 1 hour
  • 2nd time execution = 0.5 hour
  • 3rd time execution = 0.3 hour
4. The estimation is also based on the time of execution, specific to manual:

Execution time = 1 hour (manual does not depend on the time of execution)
Based on the above calculations, estimations are being done. A sample estimation spreadsheet is being attached below for reference:

No Name Type of change No of scripts Update Hrs Are New Scripts Req? No of New Scripts Creation Hrs Execution Hrs Cycle 1 Execution Hrs Regression Cycle
1 Logon Minor 6 6 Yes 2 6 5 5
2 Module1 Medium 4 12 No 1 4 3 3
3 Module2 Medium 6 12 No 5 5
4 Module3 Medium 1 2 Yes 4 1 1 1
5 Module4 Medium 4 12 No 3 3
6 Module5 Medium 13 3 Yes 8 60 10 10
Sub Totals 34 47 15 71

Related Topics – Software Testing Effort Estimation

Software Testing Post Project Reviews

The Post Project Review (or sometimes referred to as the Post Implementation Review) is a key review meeting taking place one month after the implementation of a project (or sooner if metrics are available). This review includes all team members involved in the project.
The main purpose is to review all testing activities, the effectiveness of the testing and allow comments to be made on the development procedures. The primary purpose of the Post Project Review (PPR) is to see improvements made on future projects – to learn from our mistakes and also to recognize aspects of the project that were good.
General Principles

The following general principals will be adopted, in order to ensure the success of these reviews.


The whole team contribute

It is important to involve the whole of the project team in this exercise. Large team meetings will not be encouraged, as this can become intimidating for certain team members and therefore they do not contribute. Also long meetings – longer than one hour – should not take place, as they can be unproductive. Therefore it is recommended that small teams from each area get together for a meeting that lasts no more than one hour, with a set agenda/questions as suggested below. This way everyone feels part of the improvement process. Representatives from these meetings will then come together to discuss/compare findings and report to the Management.

Measurement criteria is logged

At the meetings people must come prepared – any measurement criteria which helps establish facts must be recorded. Key metrics are:

  • Defect Detection Percentage (DDP)
  • Number of faults V’s priority/severity
  • Fix rate for faults/turnaround time
  • Schedule estimates V’s actuals
  • Number of iterations/builds of the system with timings
  • Helpdesk call log statistics

Blameless culture is adopted
It is important for people to realise that this is not a ‘finger-pointing’ exercise. If problems occurred during the project we must learn from them and attack the procedure – not the person!

The right balance between the ‘good’ and the ‘bad’
Part of the meeting should be dedicated to looking at what went well on the project (the good) and what did not go so well on the project (the bad). In order to adopt a process improvement regime, we must concern ourselves and focus on the important things/best things to improve upon.

There is an expectation from the team to change
Once we have established the ‘good’ and the ‘bad’ we must recognise and keep hold of the good aspects for the next project and be prepared to change the ‘not-so-good’ aspects. These changes must occur relatively quickly after the project so that the same mistakes do not occur again. Key areas to look at are:

  • Standards
  • Procedures
  • Processes
  • Communication (process of information)

Phases of testing (Review, Design,  Implementation)

  • Documentation (Test plans/Project plans/Requirements etc)
  • Action plan

    The key to success is an “Action Plan” being written, there must be a single point of responsibility for this action plan. The fact that everyone has contributed to this document means that ownership is shared. But by having a single point of responsibility for these actions means that changes will be brought about in the most expedient and efficient manner.

    Key questions for each group:
    Customer Services

    • How could I have contributed more to the success of this project?
    • Was I involved at the key stages of the project in order that I could do my job more effectively after implementation?
    • What have been the key issues raised, so far, by the customers on this project?
    • What is the confidence level, so far on this project (what are the measures for this)?
    • How could my manager have helped more in the improvements to this project?
    • Helpdesk responsiveness / Problem Management responsiveness
    • Training satisfaction
    • Customer Comments
    • Development/Testing

    1. Did I have the right information at the right time so that I could develop/test the project most efficiently?
    2. How could I have been more efficient with the use of my time on this project?
    3. How could I have contributed more to the success of this project?
    4. How could my manager have helped more in the improvements to this project?
    5.Where did ‘bottlenecks’ occur in the development process and how could they have been overcome?

    • Basic Error Metrics
    • Errors per Man Day Testing
    • Ratio Internal / External errors (DDP)
    • Modifications raised by customer
    • Results of end of Project reviews
    • Completion date Metric
    • Statement of delivery deadlines / slippage

    Development Team Productivity.

    • Results of initiatives aimed at reducing cost.
    • Results of initiatives aimed at improving performance.

    Business Analysts

    1. How could I have contributed more to the success of this project?
    2. How could the team have contributed more to the success of this project?
    3. Was the system built right (Verification) and did we build the right system (Validation)?
    4. How could my manager have helped more in the improvements to this project?
    5. Were the requirements clearly understood by all and easily tested?
    6. Were there communication issues with development?
    7. How easy for developers to interpret the requirements documents?
    8. How appropriate was the requirements document in the testing process – particularly where testing not carried out by author of requirements document?

    Executive Management

    1. How could I have contributed more to the success of this project?
    2. How could the executive management have supported the team more?
    3. Did we receive timely information that allowed us to make key decisions in the appropriate manner?
    4. Did the Project deliver its objectives to the organisation?

    ~~~~~~~~~~~~~~~~~~~~~~~~~The End~~~~~~~~~~~~~~~~~~~~~~~~~

    Traceability Matrix from Software Testing perspective

    Traceability Matrix from Software Testing perspective

    This is a very helpful topic for test leads and managers (also for junior testers if they want to grow).
    Traceability Matrix is used in entire software development life cycle phases:

      1. Risk Analysis phase
      2. Requirements Analysis and Specification phase
      3. Design Analysis and Specification phase
      4. Source Code Analysis, Unit Testing & Integration Testing phase
      5. Validation – System Testing, Functional Testing phase

        In this topic we will discuss:

        • What is Traceability Matrix from Software Testing perspective? (Point 5)
        • Types of Traceability Matrix
        • Disadvantages of not using Traceability Matrix
        • Benefits of using Traceability Matrix in testing
        • Step by step process of creating an effective Traceability Matrix from requirements. Sample formats of Traceability Matrix basic version to advanced version.

        In Simple words – A requirements traceability matrix is a document that traces and maps user requirements [requirement Ids from requirement specification document] with the test case ids. Purpose is to make sure that all the requirements are covered in test cases so that while testing no functionality can be missed.
        This document is prepared to make the clients satisfy that the coverage done is complete as end to end, this document consists of Requirement/Base line doc Ref No., Test case/Condition, and Defects/Bug id. Using this document the person can track the Requirement based on the Defect id
        Note – We can make it a “Test case Coverage checklist” document by adding few more columns. We will discuss in later posts
        Types of Traceability Matrix:

        • Forward Traceability – Mapping of Requirements to Test cases
        • Backward Traceability – Mapping of Test Cases to Requirements
        • Bi-Directional Traceability – A Good Traceability matrix is the References from test cases to basis documentation and vice versa.

        Types of Traceability Matrix


        Why Bi-Directional Traceability is required?
        Bi-Directional Traceability contains both Forward & Backward Traceability. Through Backward Traceability Matrix, we can see that test cases are mapped with which requirements.
        This will help us in identifying if there are test cases that do not trace to any coverage item— in which case the test case is not required and should be removed (or maybe a specification like a requirement or two should be added!). This “backward” Traceability is also very helpful if you want to identify that a particular test case is covering how many requirements?
        Through Forward Traceability – we can check that requirements are covered in which test cases? Whether is the requirements are coved in the test cases or not?

        Forward Traceability Matrix ensures – We are building the Right Product.
        Backward Traceability Matrix ensures – We the Building the Product Right.

        Traceability matrix is the answer of the following questions of any Software Project:

        • How is it feasible to ensure, for each phase of the SDLC, that I have correctly accounted for all the customer’s needs?
        • How can I certify that the final software product meets the customer’s needs? Now we can only make sure requirements are captured in the test cases by traceability matrix.

        Disadvantages of not using Traceability Matrix [some possible (seen) impact]:
        No traceability or Incomplete Traceability Results into:

          1. Poor or unknown test coverage, more defects found in production 
          2. It will lead to miss some bugs in earlier test cycles which may arise in later test cycles. Then a lot of discussions arguments with other teams and managers before release.
          3. Difficult project planning and tracking, misunderstandings between different teams over project dependencies, delays, etc
          Benefits of using Traceability Matrix

          • Make obvious to the client that the software is being developed as per the requirements.
          • To make sure that all requirements included in the test cases
          • To make sure that developers are not creating features that no one has requested
          • Easy to identify the missing functionalities.
          • If there is a change request for a requirement, then we can easily find out which test cases need to update.
          • The completed system may have “Extra” functionality that may have not been specified in the design specification, resulting in wastage of manpower, time and effort.

          Steps to create Traceability Martix:
          1. Make use of excel to create Traceability Matrix:

          2. Define following columns:

          Base Specification/Requirement ID (If any)
          Requirement ID
          Requirement description
          TC 001
          TC 002
          TC 003.. So on.

          3. Identify all the testable requirements in granular level from requirement document. Typical requirements you need to capture are as follows:
          Used cases (all the flows are captured)
          Error Messages
          Business rules
          Functional rules
          SRS
          FRS
          So on…
          4. Identity all the test scenarios and test flows.
          5. Map Requirement IDs to the test cases. Assume (as per below table), Test case “TC 001” is your one flow/scenario. Now in this scenario, Requirements SR-1.1 and SR-1.2 are covered. So mark “x” for these requirements.
          Now from below table you can conclude –
          Requirement SR-1.1 is covered in TC 001
          Requirement SR-1.2 is covered in TC 001
          Requirement SR-1.5 is covered in TC 001, TC 003 [Now it is easy to identify, which test cases need to be updated if there is any change request].
          TC 001 Covers SR-1.1, SR, 1.2 [we can easily identify that test cases covers which requirements].
          TC 002 covers SR-1.3.. So on..

          Requirement ID Requirement description TC 001 TC 002 TC 003
          SR-1.1 User should be able to do this x
          SR-1.2 User should be able to do that x
          SR-1.3 On clicking this, following message should appear x
          SR-1.4 x
          SR-1.5 x x
          SR-1.6 x
          SR-1.7 x

          This is a very basic traceability matrix format. You can add more following columns and make it more effective:
          ID, Assoc ID, Technical Assumption(s) and/or Customer Need(s), Functional Requirement, Status, Architectural/Design Document, Technical Specification, System Component(s), Software Module(s), Test Case Number, Tested In, Implemented In, Verification, Additional Comments,
          Click here to download sample advanced version of traceability matrix.